
Dark frames, subtracted
Every run also takes frames with the bias off and removes them. Stray light and sensor offset do not end up in your picture.

 Electroluminescence ImagingThermal ChamberIAMWPVS AmplifierSpectral Response Kit
Electroluminescence Imaging
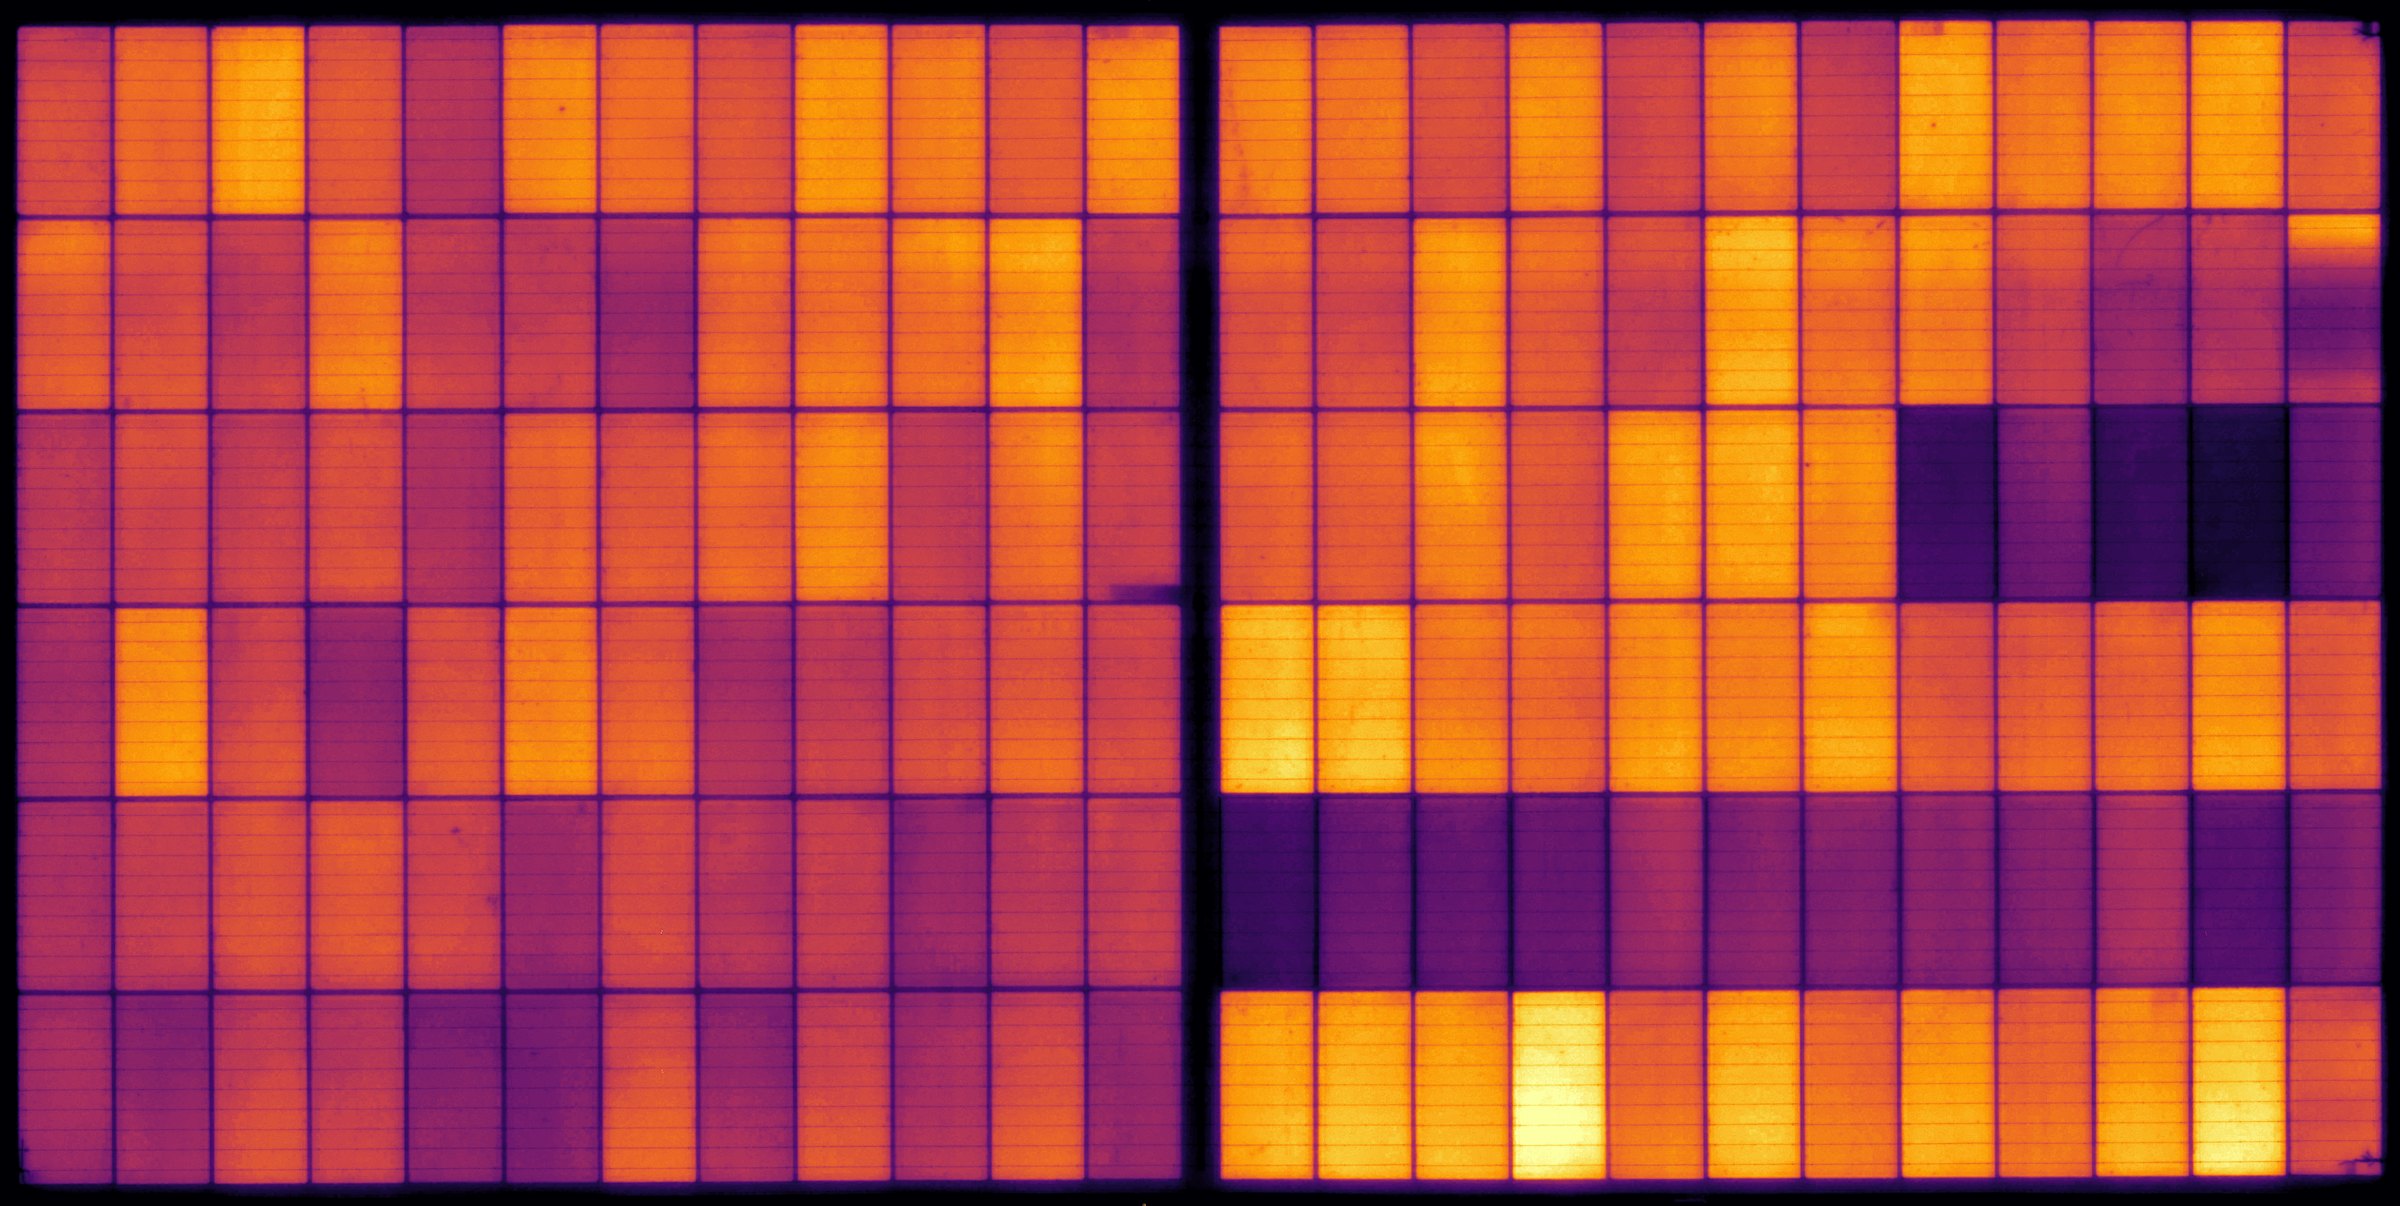
A 65-megapixel electroluminescence picture of the whole panel, 0.2 mm per pixel, at two currents in one run. Then the anomaly analysis compares it with a reference of its panel type and tells you what is wrong, where, and how much it costs the cell.
Move over the cell, or touch it, to look closer.
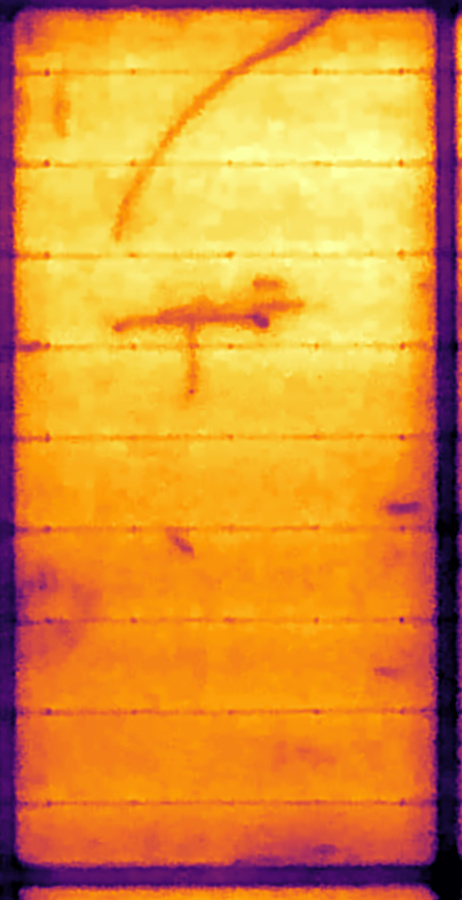
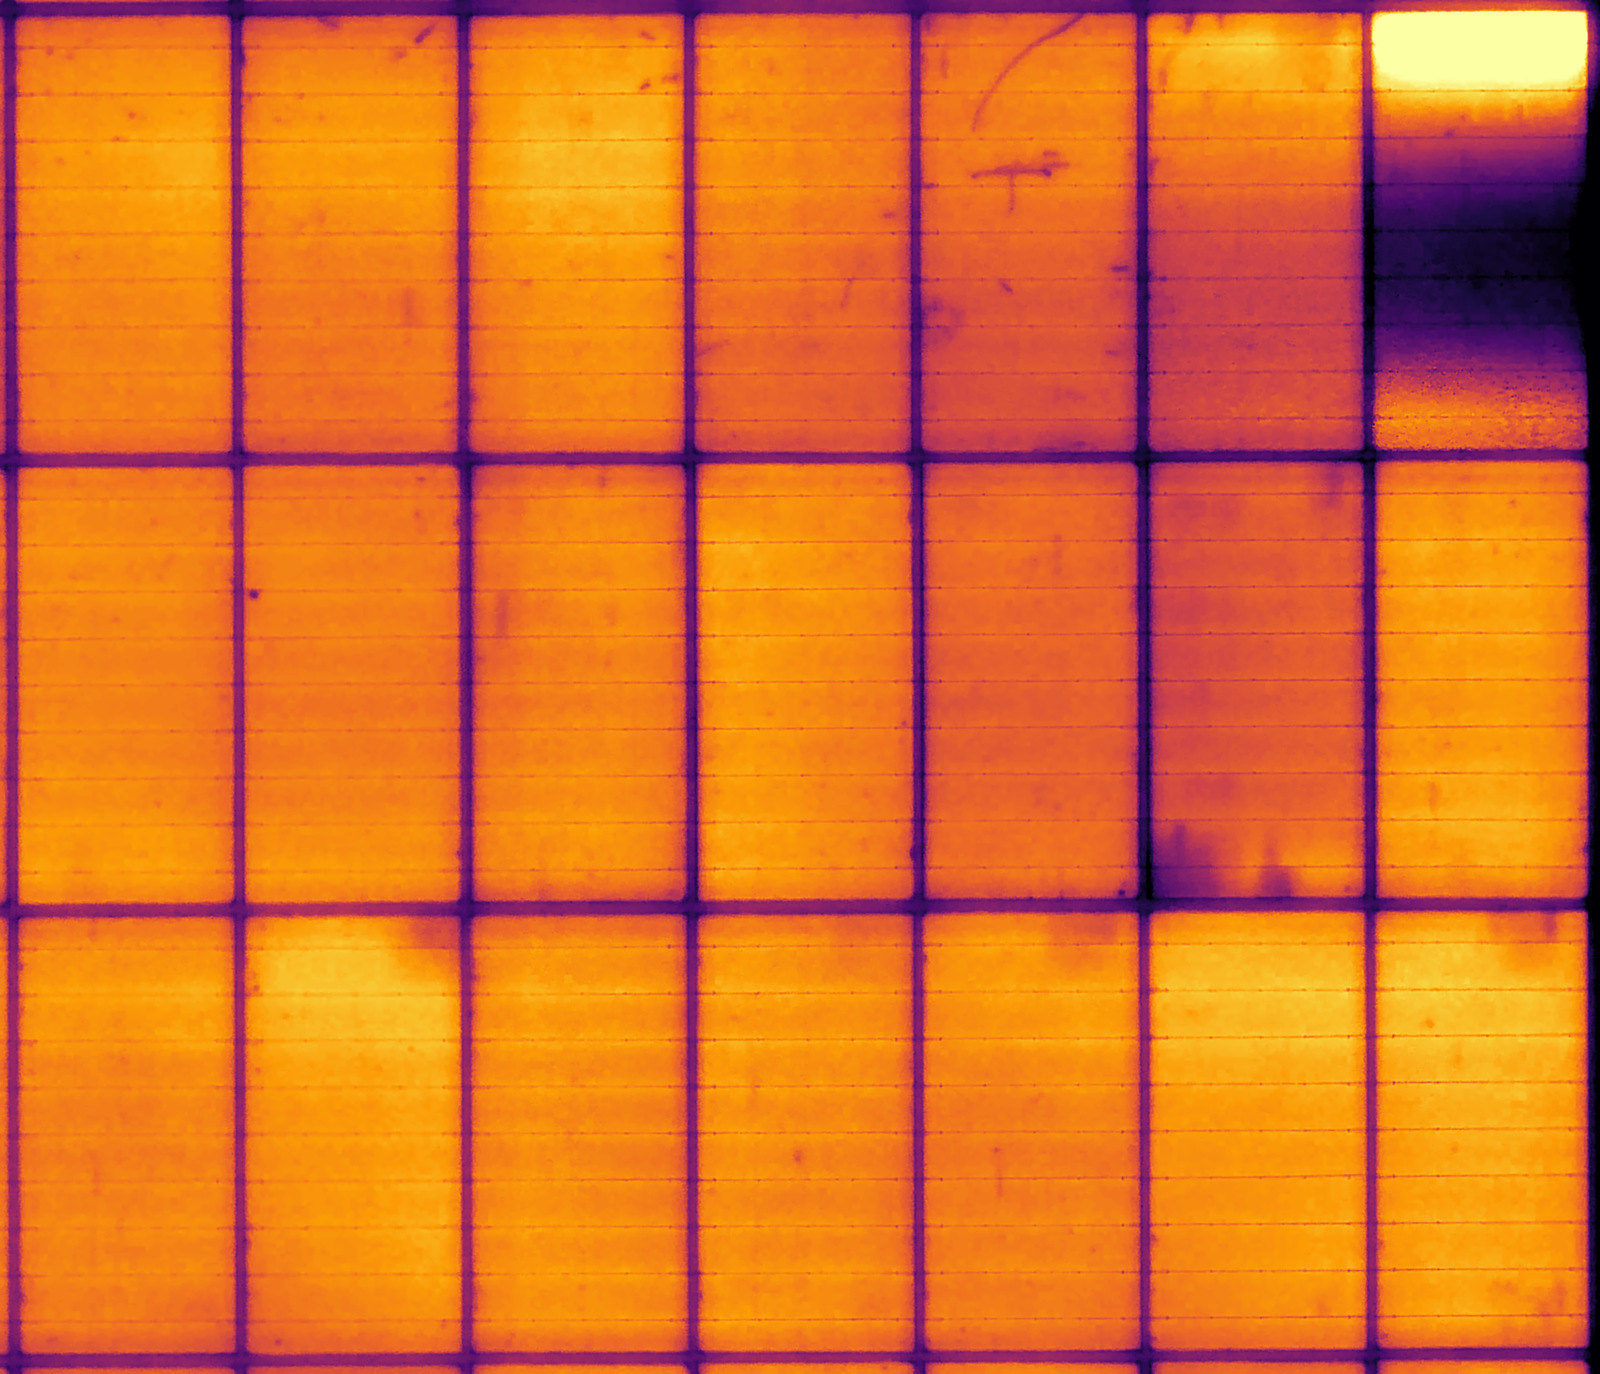
This is one half-cut cell of the panel, cut straight out of the picture at its native resolution, no upscaling, shown with the viewer's default display sharpening. 462 x 900 pixels for a 91 x 182 mm piece of silicon, about 415 000 pixels. Every camera of the bench is a 5-megapixel sensor with wide-angle optics close to the panel, so the pixels go to the silicon, not to the distance.
In this cell: a curved micro-crack running from the top edge, a T-shaped inactive area across a busbar, and small dark spots. Every busbar line is resolved.
Every run also takes frames with the bias off and removes them. Stray light and sensor offset do not end up in your picture.
Each panel type has its own exposure, found by the station itself with a few test shots. No saturated cells, no wasted dynamic range.
Saturated pixels, a lead off the panel, a camera that did not answer: the shot is flagged with a sentence a technician understands, kept for diagnosis and never analysed as if it were good.
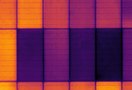
High current shows cracks and inactive areas. Low current shows what high current hides: shunts, weak cells and cells that drop out. An electroluminescence recipe takes both in the same run, with the panel never moving, so the two pictures line up pixel for pixel.
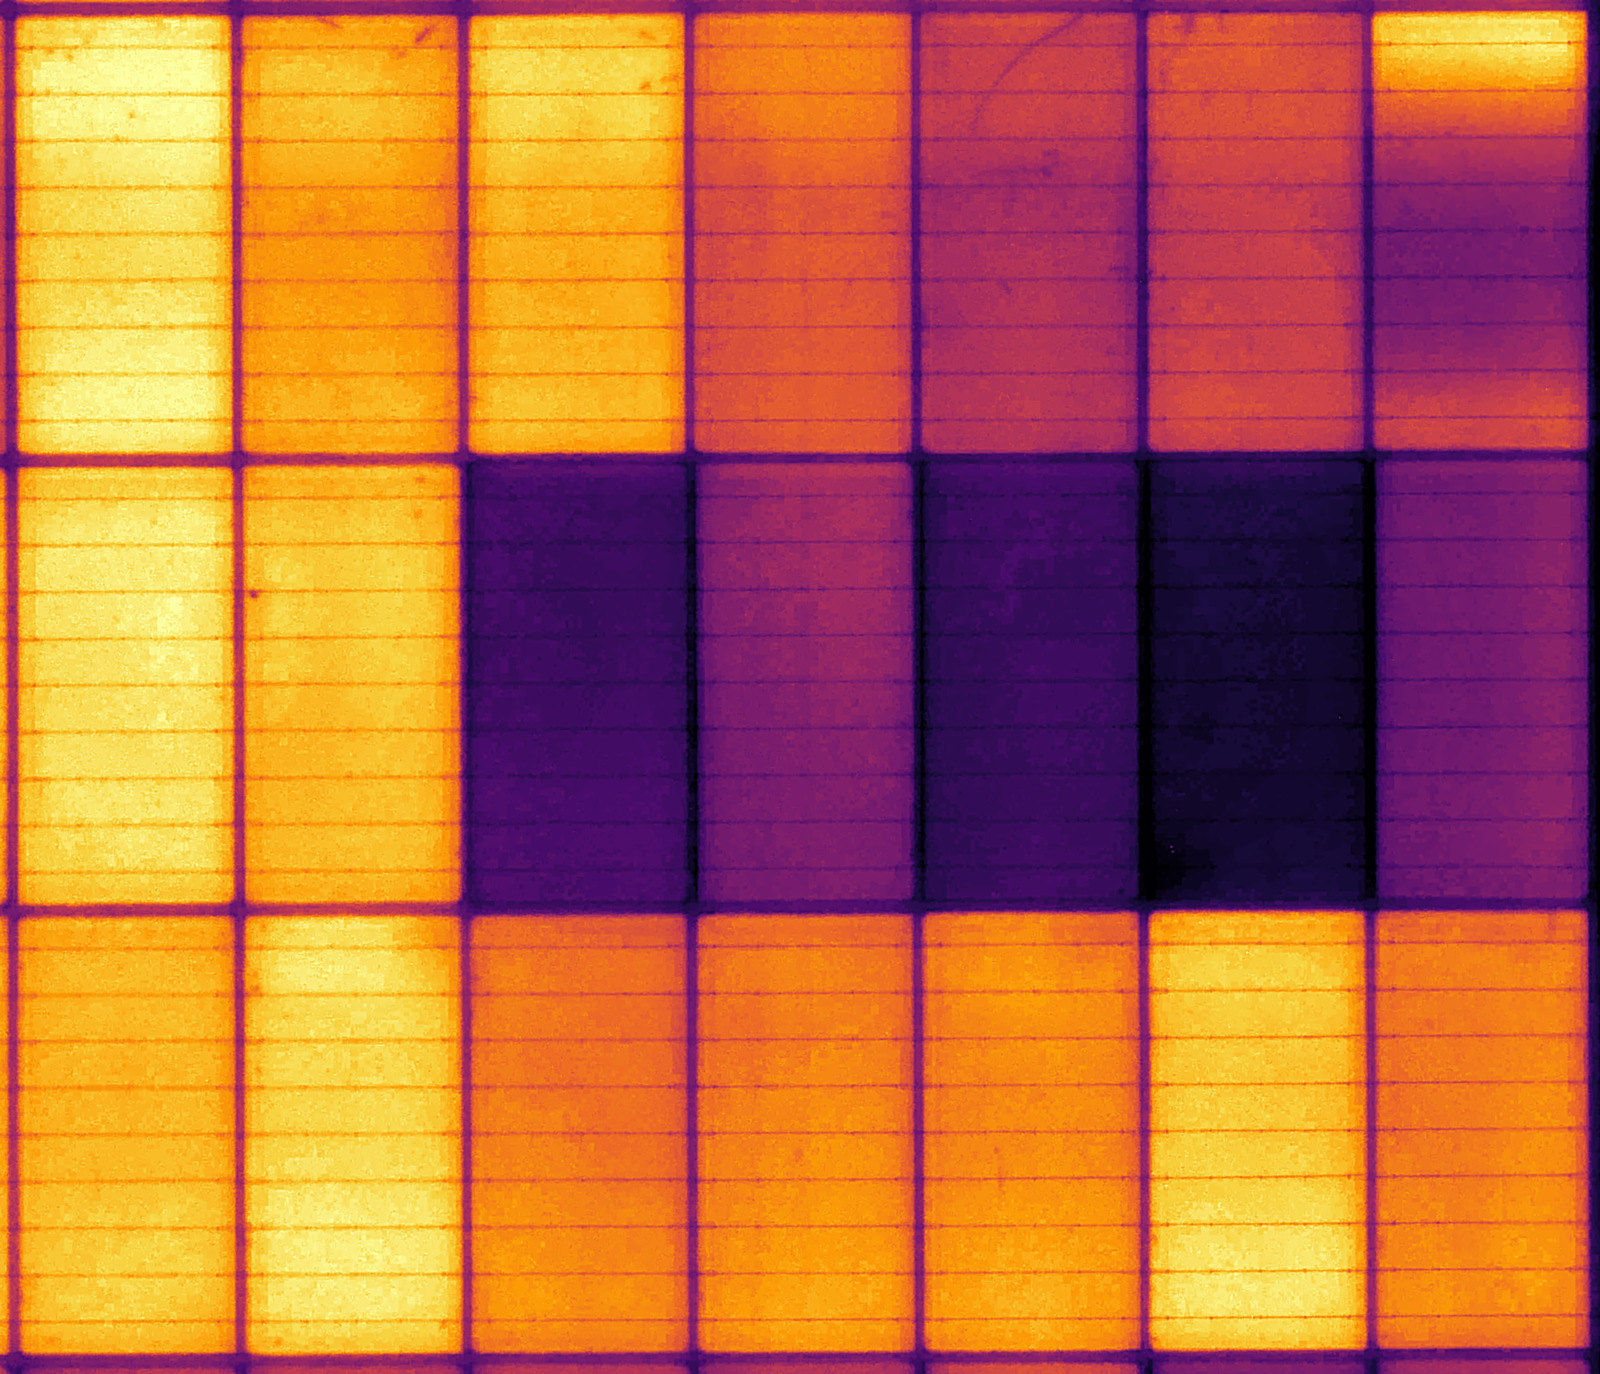
 Isc (8 A)0.1 x Isc (0.8 A)
Current as a fraction of the panel's Isc or in amperes, voltage limit, exposure: one recipe per panel type, picked automatically with the DUT.
Dark frames once, then each shot in turn, with waits that end as soon as the light is steady. The run is short and the panel stays put.
Divide one shot by the other, or a panel before and after a stress test, cell by cell with levels matched, to see exactly what changed.
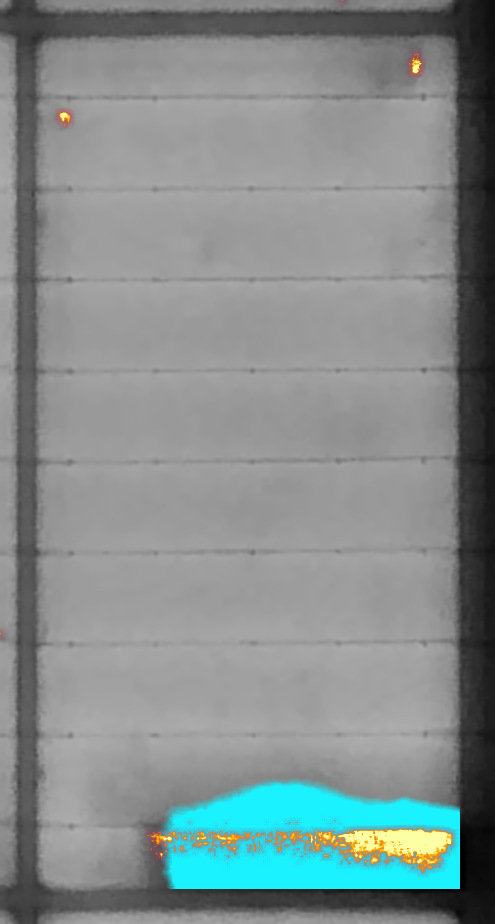
Every picture is compared with a reference of its panel type, made from pictures of good panels. What is not as expected is painted on the picture, fine things in fire, broad areas in cyan, then sorted into findings and scored cell by cell. No threshold to tune per defect, no rule to write.
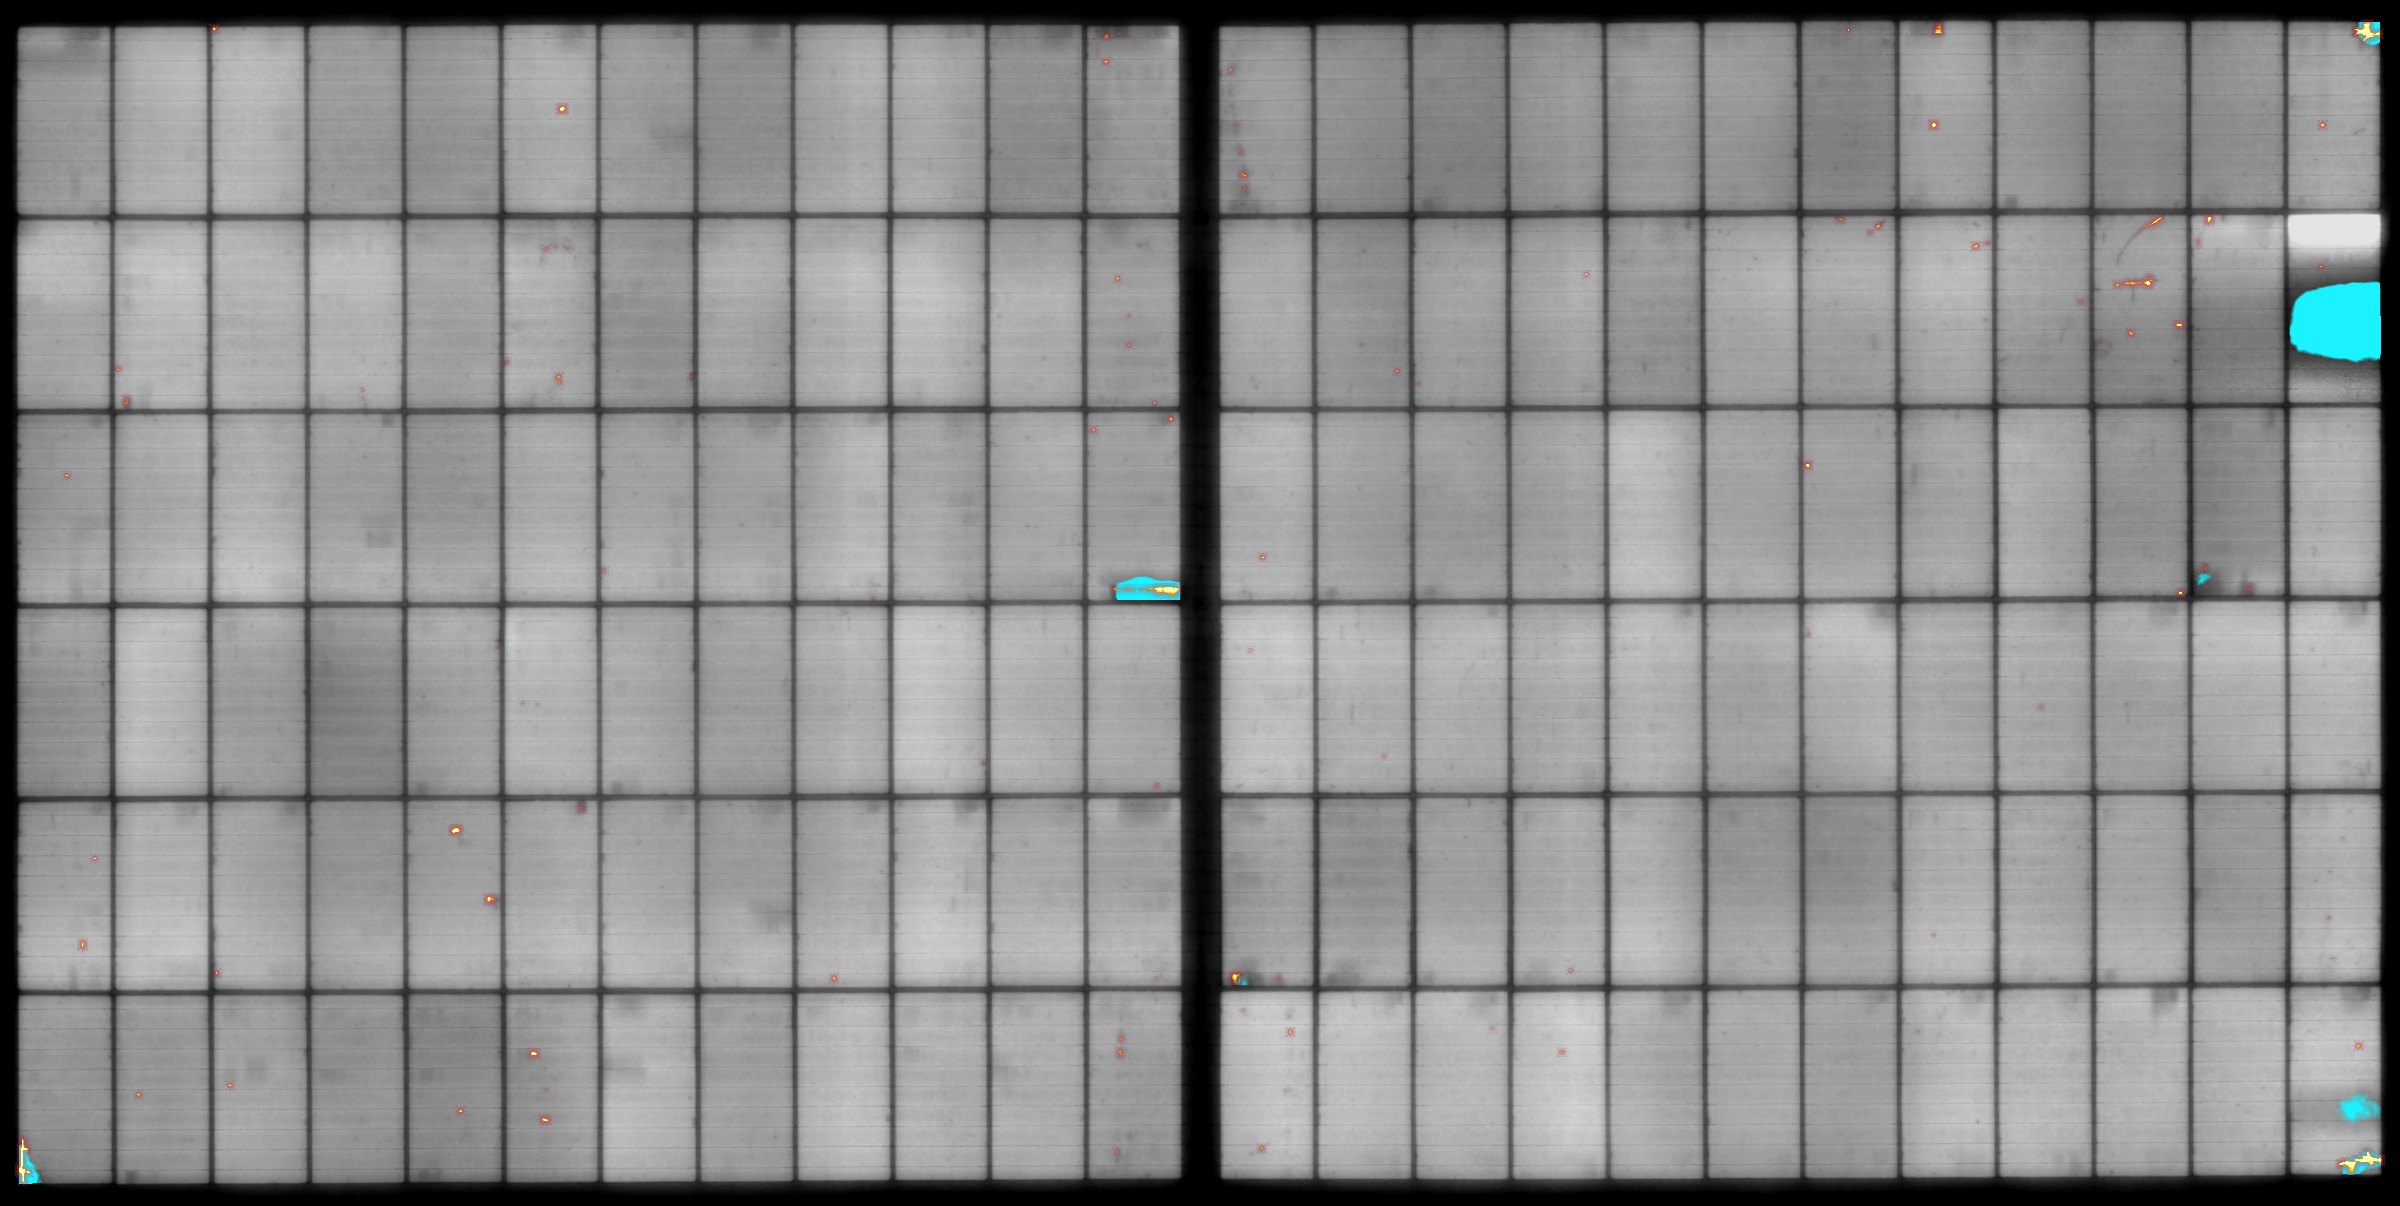
Point at a cell for its quality index and what was found in it.
Each cell gets a quality index: 100 % is a perfect cell, 0 % no cell at all. A cell that is only a little darker as a whole loses nothing, a crack counts by its length, a dead area by its size. Sort by it, bin by it, stop the line on it.
When a run has two shots, the software puts their analyses together.
Found in both shots of the run, so they are not the noise of one frame. One switch hides the small marks that only one shot shows.
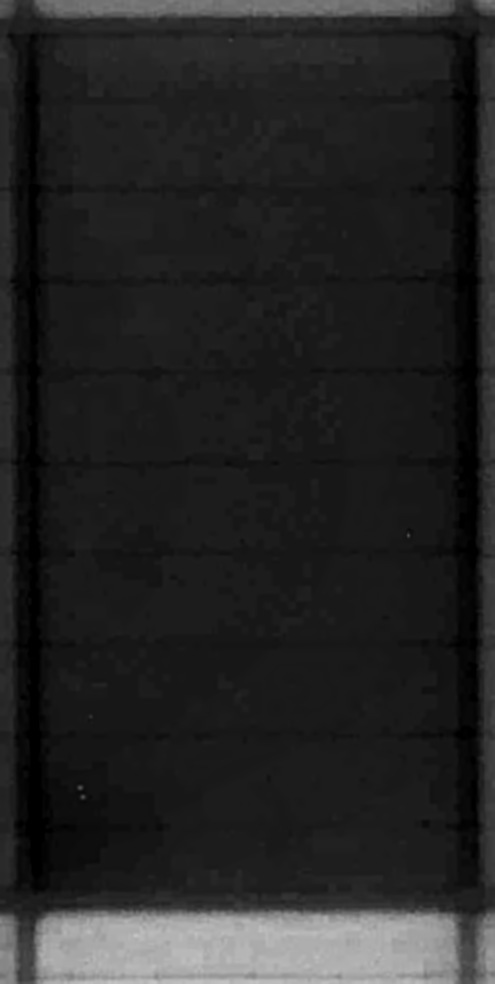
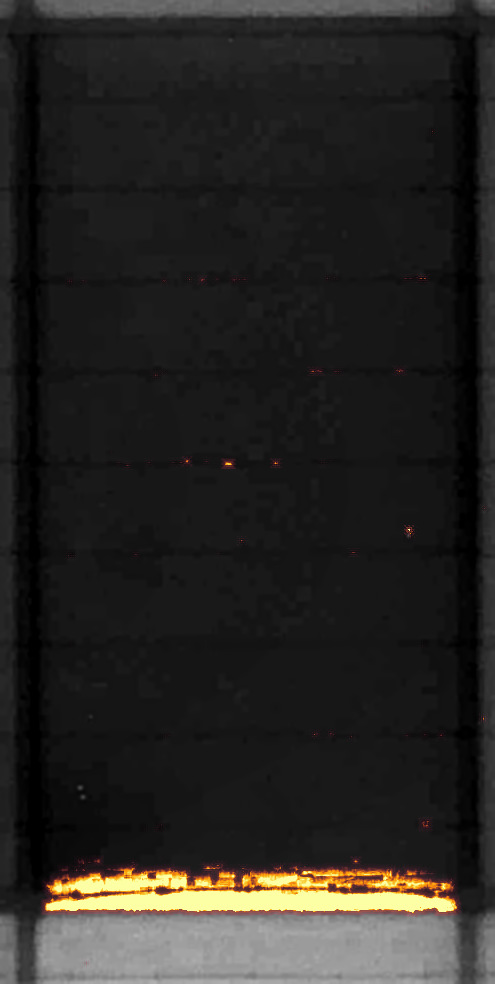
A cell or a patch that is darker at 0.8 A than at 8 A is tagged as a shunt, with both percentages written next to it.
Darker at 8 A than at 0.8 A is a series resistance: a contact or interconnection problem, not the silicon.
Divide one picture by the other and the software shows, pixel by pixel, where the panel behaves differently: the 8 A shot against the 0.8 A shot, or the same panel before and after a stress test. Both pictures are first brought to the same level, and where that level is taken decides what you see.
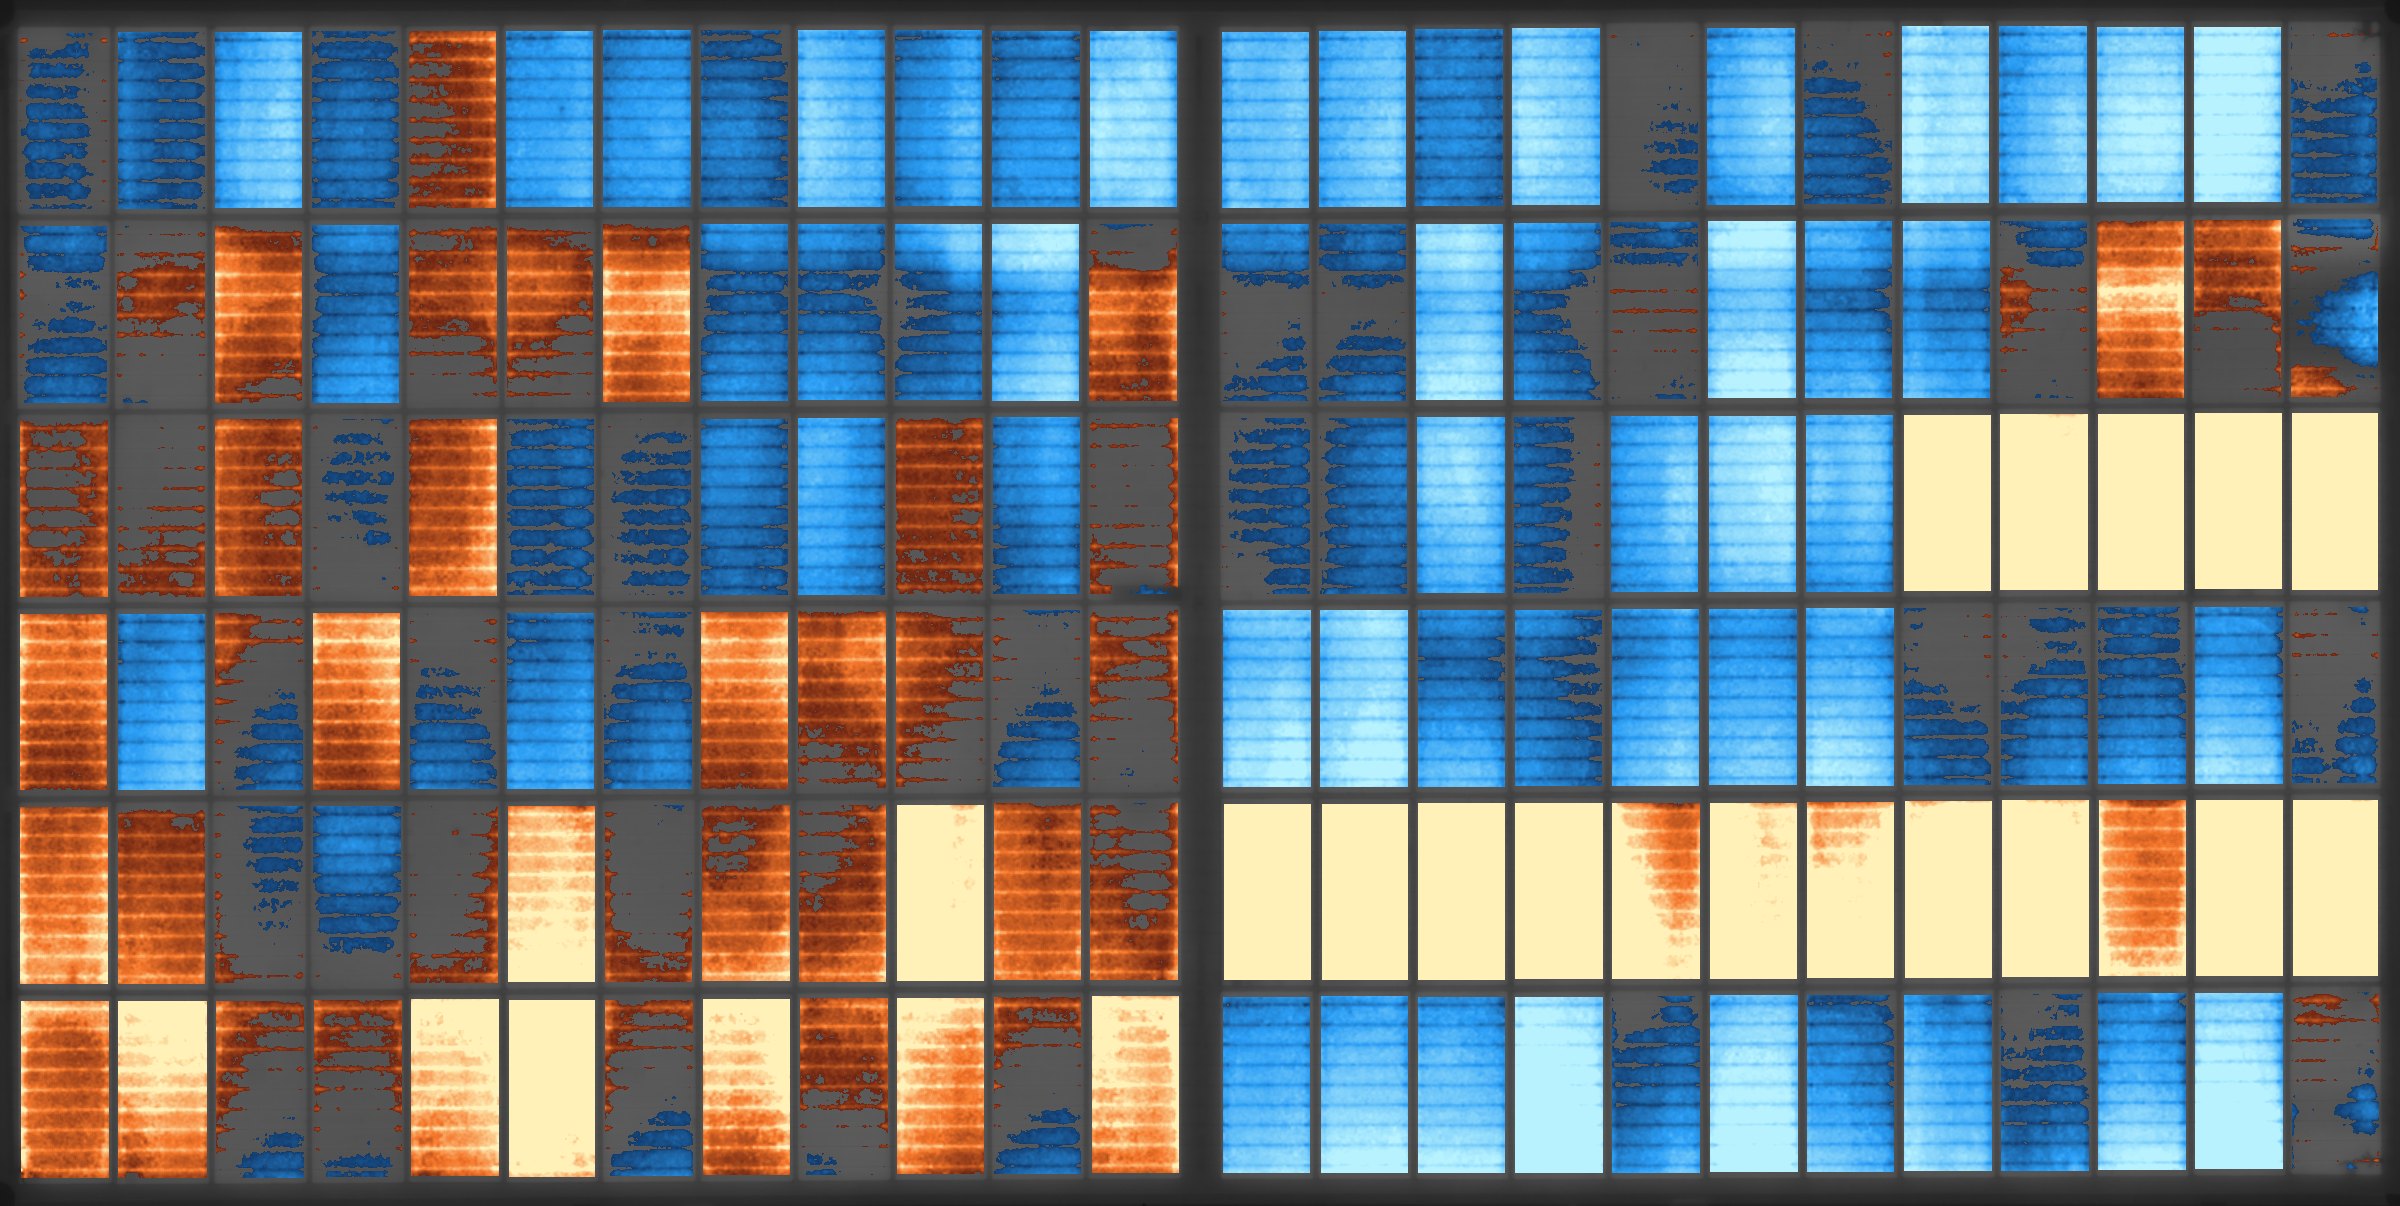
The delta of the example run, 8 A divided by 0.8 A, computed from the two real pictures with the software's default settings.
Any two results of the same panel can be compared: before and after damp heat, thermal cycling or a mechanical load. The pictures are lined up on the corner of the panel.
Each cell, around each point for the finest detail only, the whole panel, or as taken. Ratio or difference, smoothing, cell borders left out, range and threshold are all yours to set.
Next to the picture: a histogram of the delta, its mean and spread, the share of the panel beyond the threshold, and the twelve cells that changed most, one click to open each.
Four cells of the example, at native resolution. Hover a picture to take the map away and see what is under it.
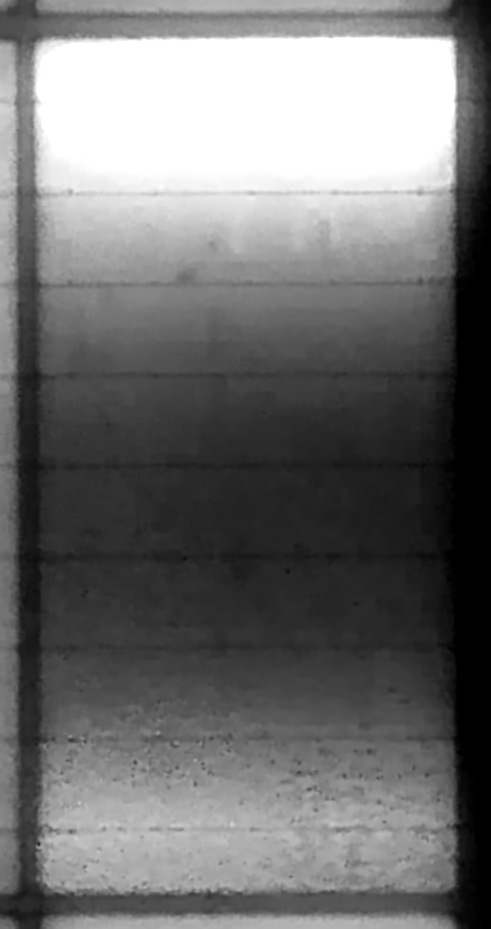
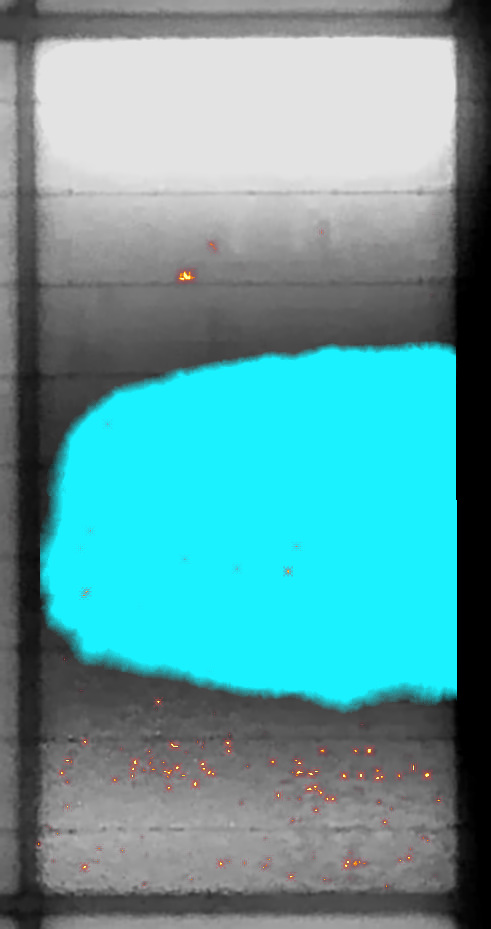 B24 · 8 A
A large part of the cell is cut off and dark: a broad area in cyan. The lowest cell of the panel at 8 A.
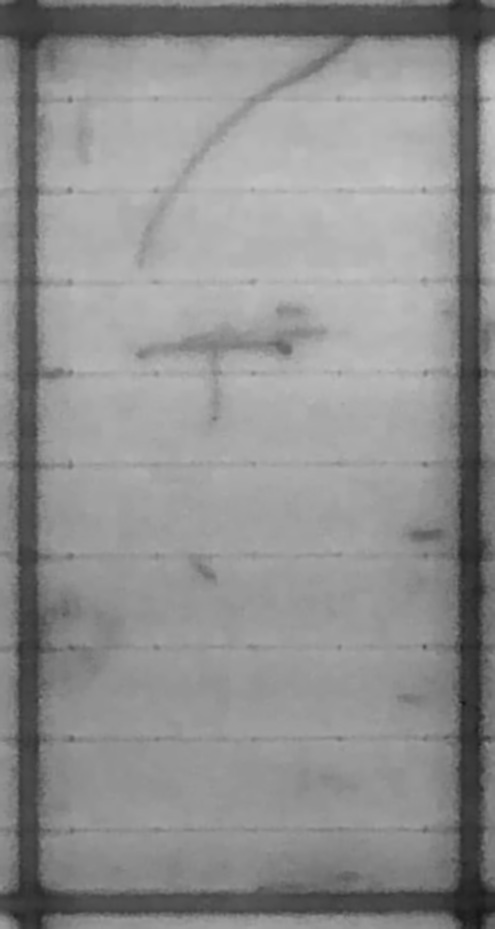
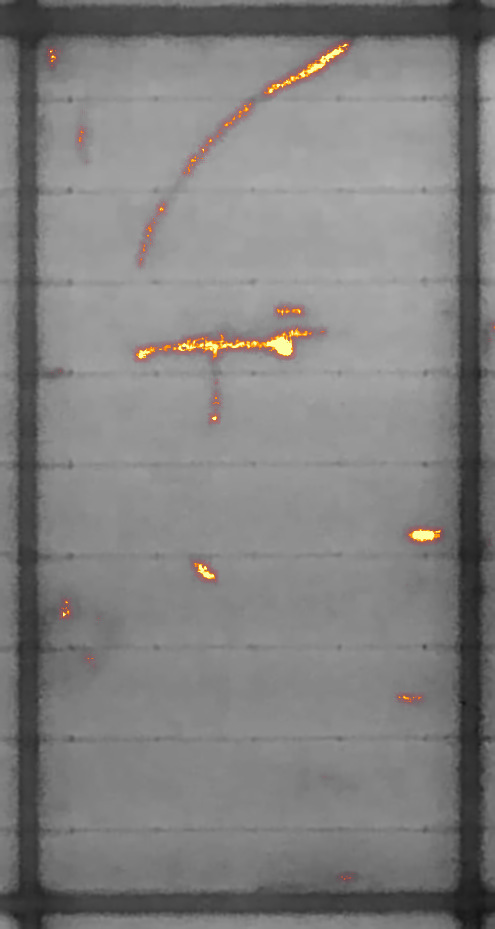 B22 · 8 A
The curved crack and the T-shaped one of the close-up above, traced in fire, with small spots around them.
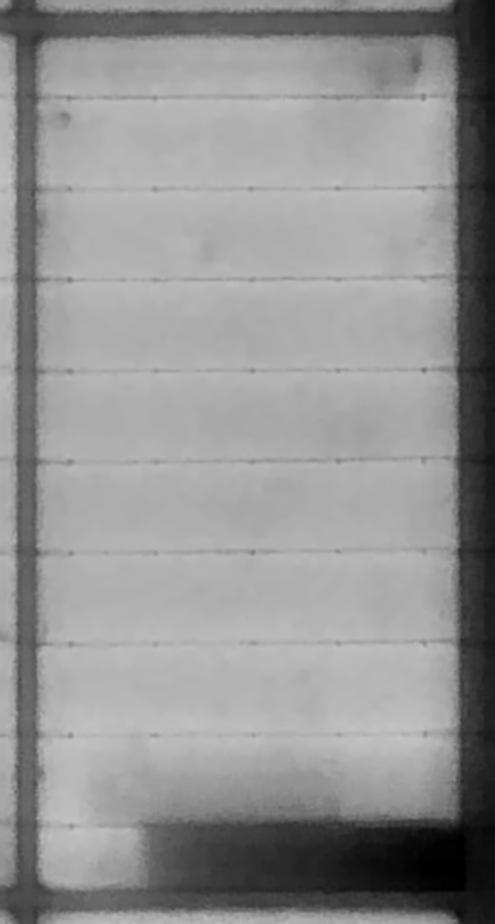
 C12 · 8 A
A long crack with a degraded part beside it, 30 % darker than the rest of the cell, as dark at both currents.
 C23 · 0.8 A
59 % darker than a typical cell at 0.8 A and only 8 % at 8 A: darker at low current, so the software calls it a shunt.
Hover to hide the map
The electroluminescence workspace sits next to the IV results in PVStudio.
Tiled image pyramid: the full 65 MP picture pans and zooms without waiting.
Hover any cell to enlarge it, step from cell to cell with the keyboard.
Grey, inferno, magma, viridis, turbo and more, with levels and contrast equalisation: for the eye only, the data is never re-encoded.
Fine and broad layers, threshold, colours, and a key to hold the map away and see what is under a mark.
Attach and align a normal photo of the panel to compare with the electroluminescence picture.
PNG, TIFF or JPEG of any result at full resolution, for your reports and your customers.
Kinds can be hidden, and operators add their own marks on the picture. The marks are saved with the result.
The electroluminescence shots are taken in the same run as the IV curve and saved in the same measurement, so a module's power and its picture never get separated.
The analysis engines arrive as signed, encrypted packages through Pasan Cloud. Your station improves without a reinstall.
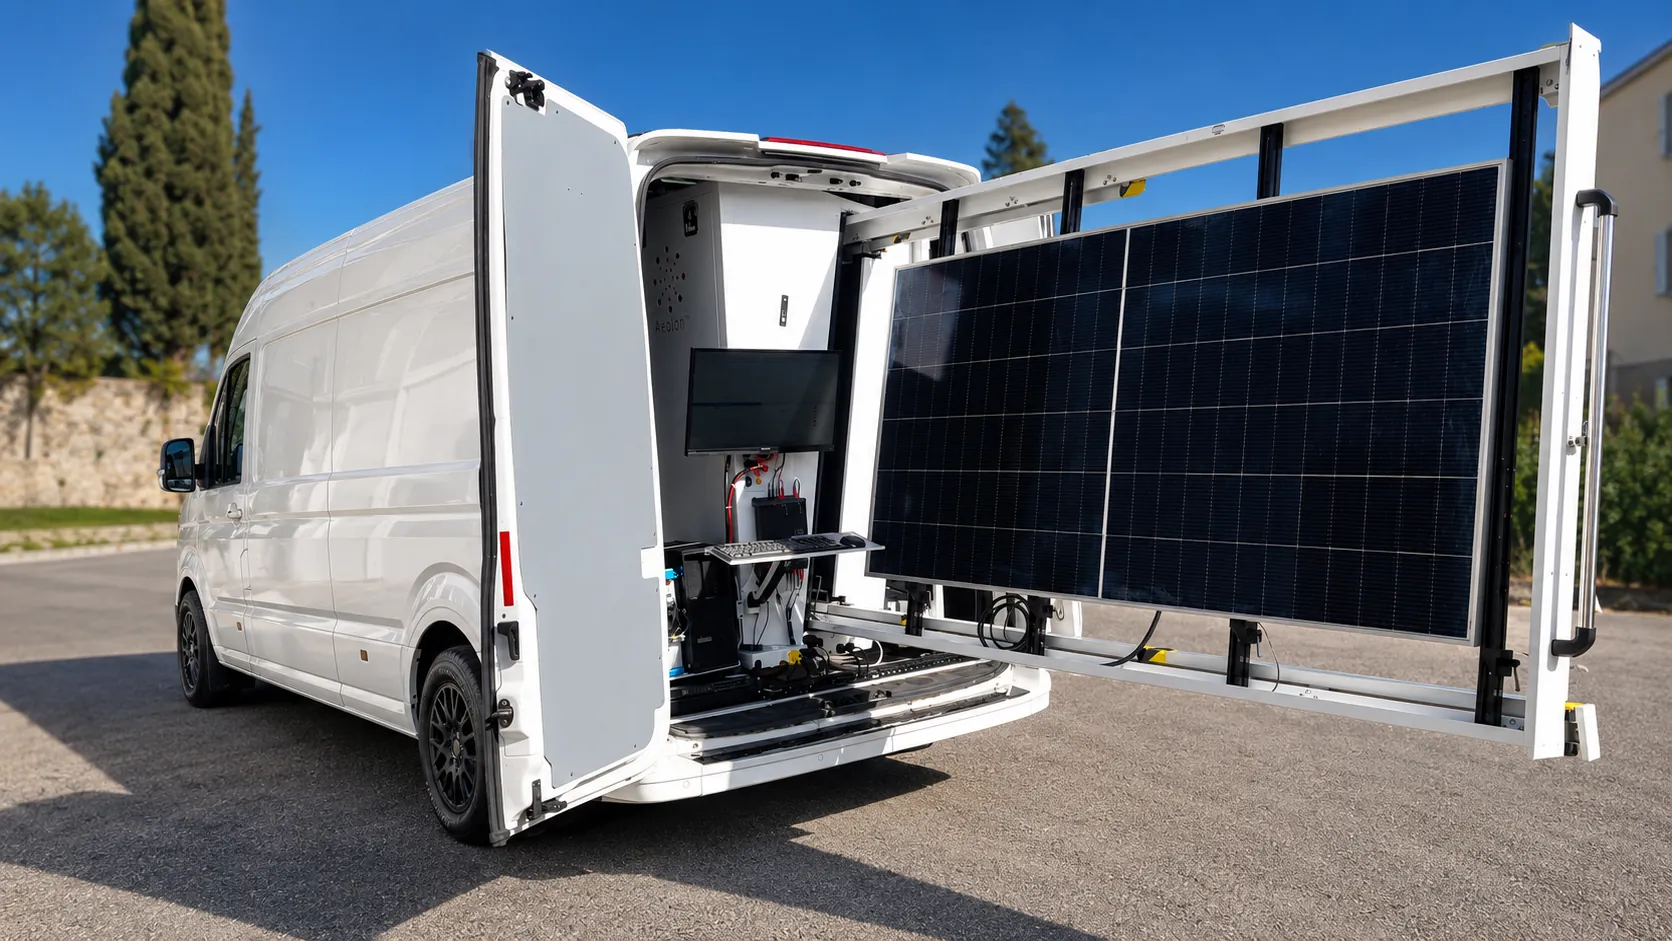
Electroluminescence Imaging runs in PVStudio beside the I-V measurement, on the same station and in the same measurement file.
Electroluminescence imaging of PV modules has its own IEC technical specification, and qualification labs use it before and after every stress test. Electroluminescence Imaging is made for both.
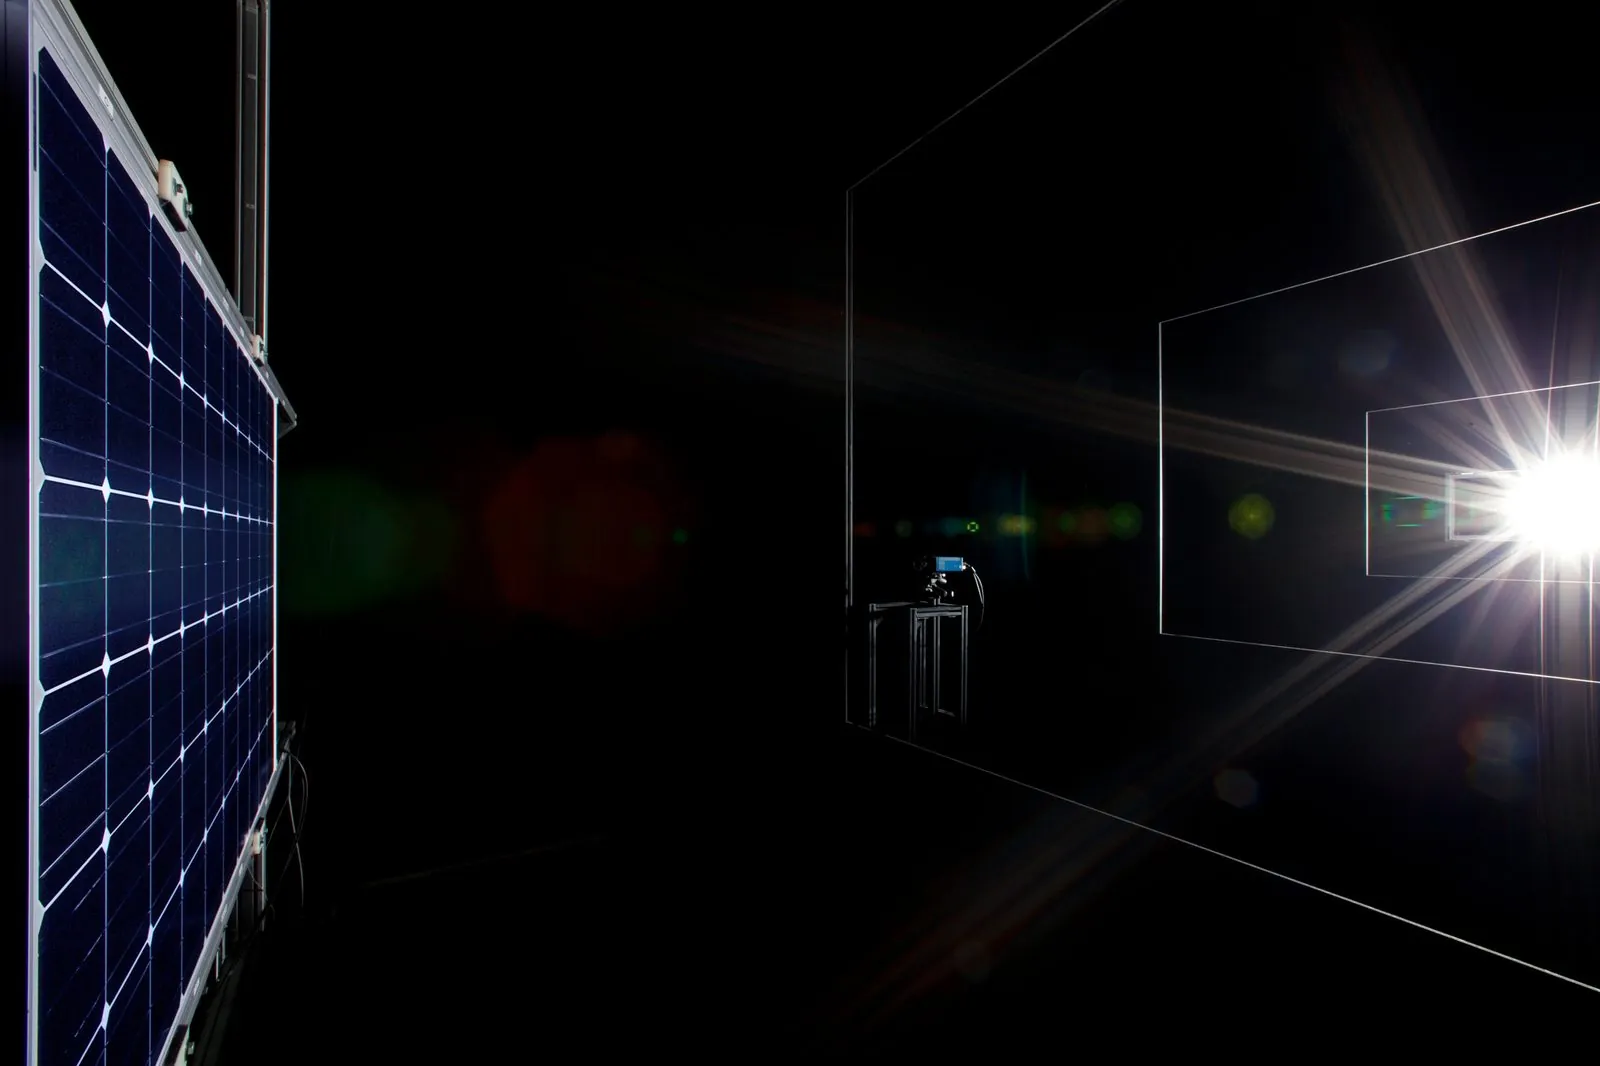
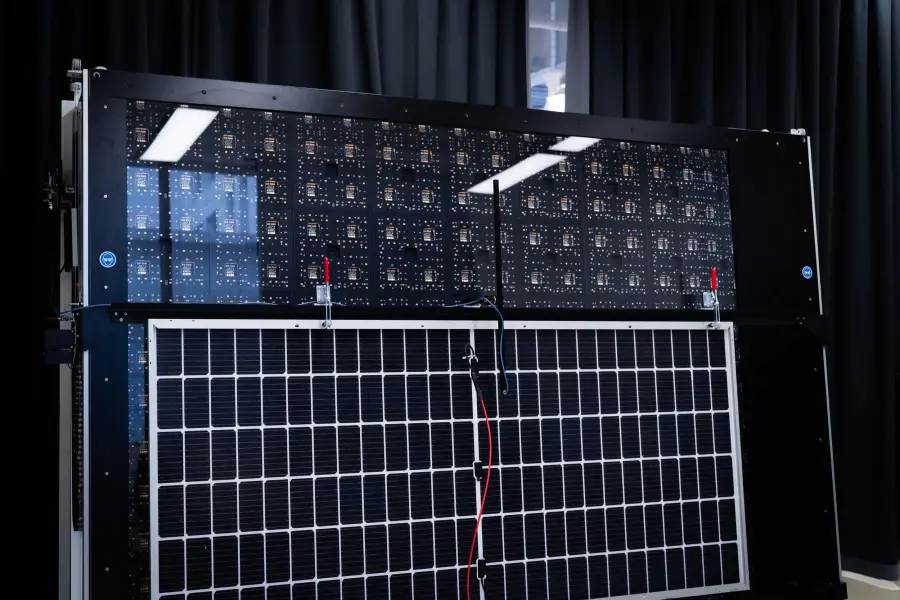
Electroluminescence of photovoltaic modules: the module in forward bias in the dark, a camera that sees the near infrared, one picture at Isc and one at a lower current. Our electroluminescence bench takes exactly that pair, Isc and a tenth of Isc, in one run.
Qualification and safety testing: thermal cycling, damp heat, mechanical load. Labs image a module before and after each sequence; the delta compares the two pictures cell by cell and shows what the stress did.
The I-V curve of the same run, measured on the Nexun or HighLIGHT simulator, is saved in the same measurement as the electroluminescence pictures: power and picture of one module, never separated.
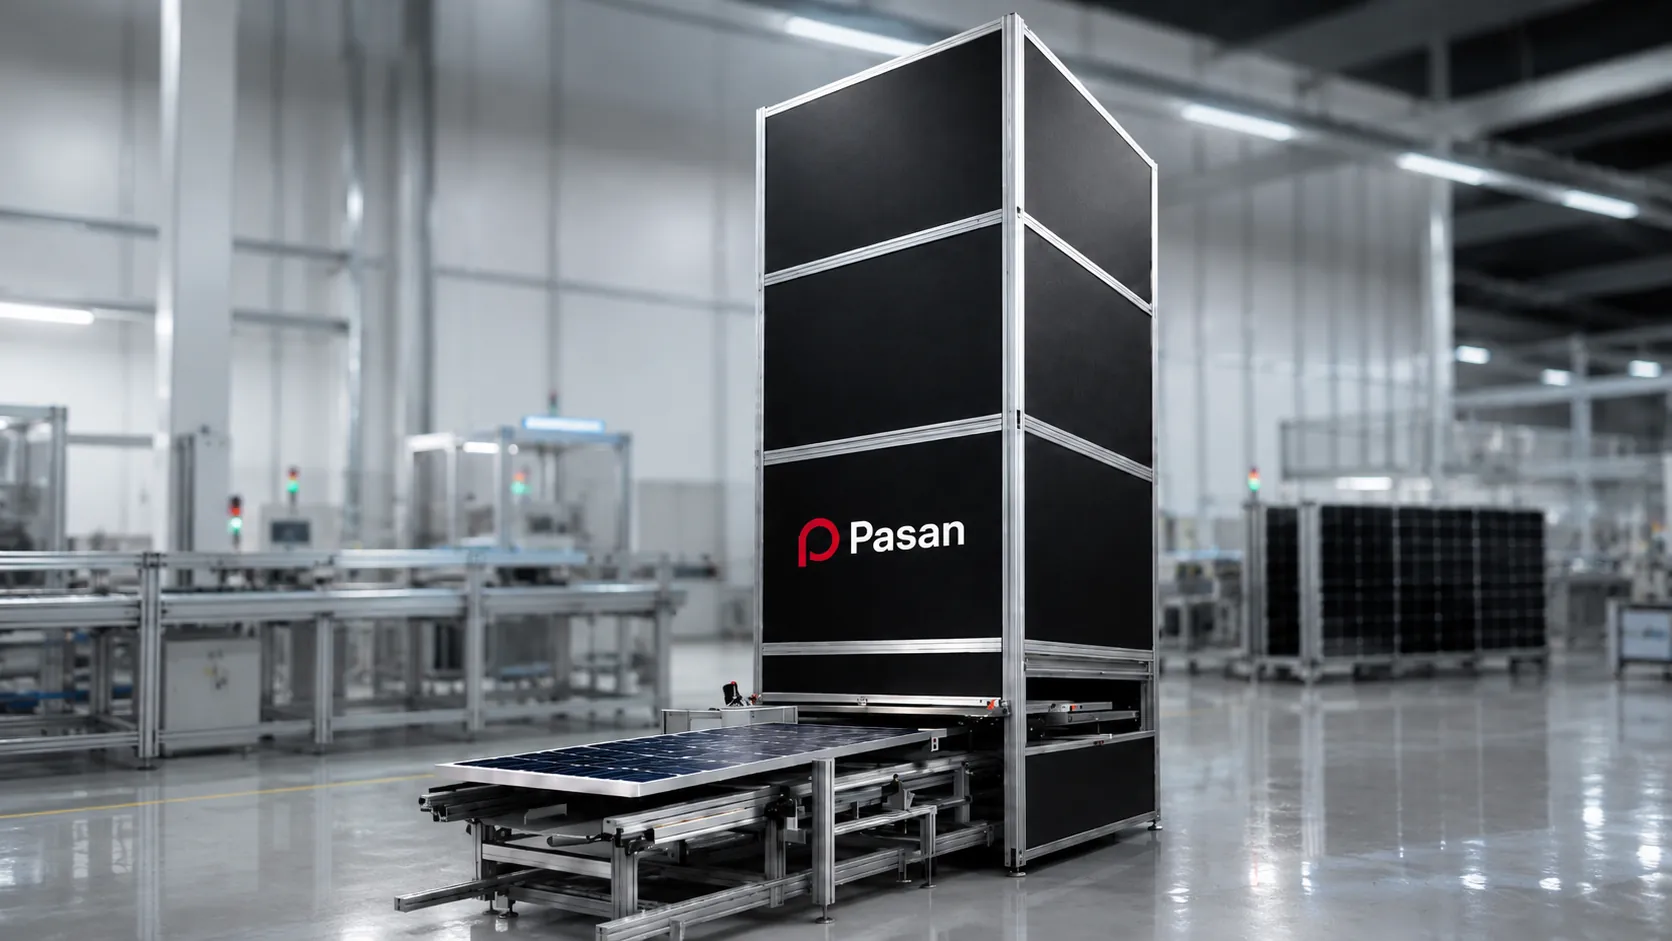
Pasan has built the reference solar simulators for module makers and test labs since 1978, and Avalon ST has made full-LED simulators since 2018. Electroluminescence Imaging comes from the same engineers: the cameras, the bench electronics, the analysis and the software are designed in-house, and we measure on them every day.
Send us a module, or ask for the full-resolution example, and judge the detail for yourself.